Tracking the performance of the NHS in England, Scotland, Wales & Northern Ireland.
The NHS service across the four nations of the UK regularly publish important datasets relating to the performance of the urgent and emergency care system. The Royal College of Emergency Medicine analyses this data which is used to inform our policy and campaigns work.
Since May 2021, attendances have remained consistent with pre-COVID attendances. Although there have been fluctuations in demand, attendances have remained relatively stable and consistent with pre-COVID-19 levels.
The four-hour standard is an operational standard pledged in the NHS constitution that 95% of patients should be admitted, transferred, or discharged from an ED within four hours. It is an indicator of patient outcomes and safety, and accountability. The standard has not been met in England since June 2013. In December 2022, the UK Government announced a threshold target of 76% to be hit in England by March 2024. Scotland last met the standard in June 2020; before this Scotland hadn’t met the target since July 2017. Since records began, Wales and Northern Ireland have not met the standard.
Data from each UK nation on 12-hour waits from the patient’s time of arrival shows that more patients than ever before are experiencing extremely long waits in our EDs. In England, the NHS requirement is that no more than 2% of patients should wait 12 hours or more from their time of arrival. This pledge has not been met in England since April 2021.
+ England
Emergency Department performance data for England, March 2025:
Summary:
Supplementary ECDS Analysis March 2025 (12-hour length of stay data measured from the time of arrival) data show:
The latest Emergency Department performance figures published by NHS England for March 2025 show:
Beds data for March 2025 show:
Emergency Department performance data for Scotland, April 2025:
Summary:
Data:
Wales NHS Emergency Department Performance Data – January 2025
Summary:
Figures:
Quarter 4 2024/25 (January – March 25) Emergency Department data:
Summary:
Quarterly Figures:
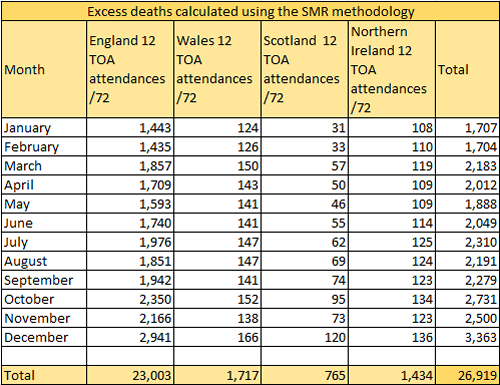
Using the best available evidence, a scientific study published in the Emergency Medicine Journal, we calculate an estimated number of excess deaths occurring across the United Kingdom associated with crowding and extremely long waiting times. These figures are based on modelling from the EMJ study which show that for every 72 patients waiting between eight and 12 hours from their time of arrival in the Emergency Department there is one patient death.

NHS England UEC sitreps – week 19 2024/25 (17th March – 23rd March)
Summary for week 19:
Beds
Ambulance Offloads
Beds Occupied by Long-Stay Patients (Type 1 trusts)
Criteria to Reside
Flu (Type 1 trusts)
Diverts
Absences
(NB. Over the past few years, the winter sitreps have commenced at different points in the winter season. To keep things consistent across calendar weeks, we have called this week’s analysis week 19 in our records, even though it is technically week 16 of publication. This helps us to sync our reporting to get a clearer picture of how winter is playing out, making it easier to spend trends over time.)
